
I recently attended an Apple Educators’ Institute in Texas and there are always a few things that resonate with me post conference. One in particular was the spotlight session by Stephanie Thompson on the use of Equity Maps. As an English teacher, I am constantly getting my classes to work in groups. But at the back of my mind, there is always the question of equity. Who is participating fully? Who is being excluded? Who is overlooked and has given up trying to be heard? Stephanie focused on gender equality, which I will pursue with my classes. But in addition to this, in the New Zealand context, we have priority learners. With these students, teachers have a hunch about participation and contribution. But now, with the aid of equitymaps.com we have group analysis and data at our fingertips. And it is instant.
The data you get answers the question of equity of participation. You get gender balance, amount of time spent participating, and even how many times the teacher spoke to the class or group. You can see this in graphs, or look at individuals and see how much of the discussion they contributed to. As the website says:
[su_panel]Is everyone sharing air-time?Is someone with many ideas a little too quiet?
Someone can’t keep quiet?
Is the teacher doing most of the talking?[/su_panel]
I decided to introduce equity maps, not quite yet to my classes but rather to a community leaders’ meeting. In this community of teachers, we are working across six schools, with teachers of year 1 through to teachers of year 13. We actively promote collaboration and some of us are currently working on a moderation process for use across the community. This is easier said than done, given that the jargon in a primary school differs to a high school. The writing tasks are quite different. And we are looking at writing from across the curriculum, from years 1 to 10 at this stage. At this meeting we had got to the point of finally refining and just about producing our matrix.
I mapped the discussion. While moderation doesn’t sound all that exciting, there was a sense of energy because we could finally see that the hours of refining the matrix was finally paying off. At the end of the session, this is just some of the data I had:

I could show the group members who had contributed, how many times, and for how long. They could compare their contributions to the rest of the group. The equity factors showed that they had been quite inclusive, but this could definitely be improved on. And then I discovered when I hit the “playback session” that there is a voice recording of the participation from each member in small sound bites.
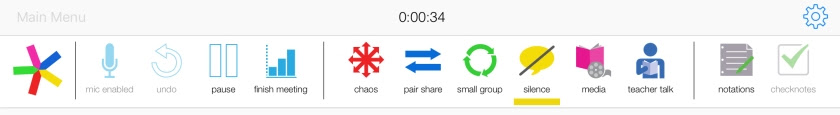
Dare I say that I had to hit the “Teacher Talk” icon 19 times. This statistic surprised the teacher that was leading our group, because she didn’t think she had interrupted that many times. I’m happy to say I never had to hit the “chaos” icon, but then I also had to avoid the “silence” icon because they were never silent. Teachers in a group love to talk!
The power of this tool is immense. As Stephanie said, “Whose voice is not being heard?” With this tool, you’ll have more than a hunch. You’ll have the data to back that hunch up. If you are wanting to promote collaboration, this is the ideal tool. Thanks to Stephanie for her inspiration, and to app creator Dave Nelson and EquityMaps.